As the name suggests, the mathematical relationships shown in inequality graphs are always unequal. The values in these graphs satisfy conditions, including "greater than" or "less than." Inequality graphs show ranges of possible solutions, which are highlighted by shading regions or areas of the graph. They simplify complex algebra so you can see which values satisfy one or more inequalities.
This guide will show how to plot inequalities, explain shaded regions in graphs and the meaning of inequalities that overlap. Step-by-step examples are included, and you can test your understanding with quiz questions. This article is suitable for GCSE Maths revision, including the exam boards OCR and Edexcel. If you need help learning this topic, TeachTutti has the best GCSE Maths tutors who can tailor lessons to your needs, in-person or online.
Inequalities on Graphs
An inequality is a mathematical expression. It shows two unequal values that have a relationship, such as:
- Greater than (>)
- Less than (<)
- Greater than or equal to
- Less than or equal to
Inequalities represent a range of possible solutions rather than a single answer. Plotting these inequalities on a graph shows all the possible solutions. It normally involves drawing a line and shading the areas that are valid solutions.
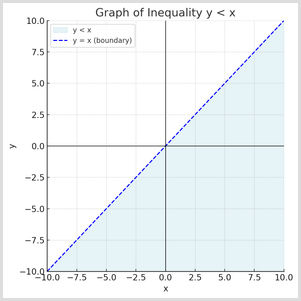
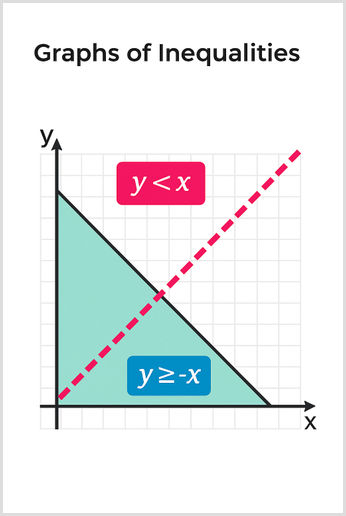
An example is y < x. You draw a dotted line on the graph for the equation y = x. This shows the points on the line that aren't included. You can then fill in the region below the line to show where y is smaller than x:

Another example is y is greater than or equal to -x. Here, the line showing y = -x will be solid, because points on this line are included in the solution. The area above this line is shaded to show all points where y is greater than or equal to -x.
You can visualise solutions using graphs of inequalities. This is particularly useful when dealing with complex algebraic problems.
Drawing graphs of inequalities
There are clear, manageable steps to take when plotting a graph of inequalities. By following the steps outlined below, you can accurately plot any inequality on a graph:
- Draw the boundary line - Treat your inequality as a regular equation, e.g. y < x becomes y = x. Plot this line on your graph.
- Solid or dashed line - The type of line is an important consideration. If the inequality is strict, use a dashed line, e.g. < or >. This means points on the line are not included. If the inequality includes equality, draw a solid line, e.g. less than or equal to. Points on this line are included.
- Shade the region - Start with a point that is easy to evaluate, unless it lies exactly on your line. The easiest point is (0,0). Substitute this point into the inequality. If the point is true, shade the side of the line that contains this test point. If it's false, shade the other side of the line.
For example:
- Let's say the inequality is y is less than or equal to 2x + 1.
- Draw the line y = 2x + 1.
- The inequality includes equality because it uses "less than or equal to". This means we use a solid line.
- Use the test coordinate (0,0). 0 is less than or equal to 2(0) + 1, so 0 is less than or equal to 1. This is true, so you need to shade the region that satisfies the system of inequalities.

Examples of inequalities and overlapping regions
We have listed several examples of inequalities. The challenge is to know how to graph multiple inequalities together. GCSE exam questions will typically expect you to challenge real-world problems with budgeting or production constraints.
Example 1: Two Inequalities intersection
Let’s graph these two inequalities together - y > x - 2 and y is less than or equal to -12x + 3:
- First inequality (y > x - 2) - Draw the line y = x - 2 as a dashed line (it's a strict inequality). Shade the area above this line.
- Second inequality (y is less than or equal to -1/2x + 3) - Draw the line y = -1/2x + 3 as a solid line (inequality includes equals). Shade the area below this line.
- The overlapping shaded region shows the solutions that satisfy both inequalities. Any point in this region solves both conditions at the same time.

Example 2: Real-life scenario
Imagine you're running a bakery selling two products: cakes and biscuits. You have limited baking time and ingredients:
- Cakes take 2 hours to bake. Biscuits take 1 hour.
- You have a maximum of 10 baking hours per day.
- You must bake at least twice as many biscuits as cakes.
Use inequalities to represent this:
- x = number of cakes, while y = number of biscuits.
- Time constraint - 2x + y is less than or equal to 10.
- Minimum biscuit constraint - y is greater than or equal to 2x.
- The overlapping region shows the points that satisfy all the baking constraints. As we can see, visualising complex inequalities is straightforward when you systematically plot each one.

Quiz questions
We have listed questions on inequality graphs to test your knowledge. They are divided into general knowledge questions and visual quizzes using graphs.
1
What line should you use when plotting the inequality y < 3x + 2?
2
Why do we shade areas of a graph when plotting inequalities?
3
Which inequality is correctly shown by the shaded region?
4
Which point satisfies both inequalities shown in the graph?

5
What inequalities are shown if both lines are dashed?

6
Which inequality is correctly shown by the shaded region?

Summary - Graphs of Inequalities
We have explored how to plot inequalities step-by-step, including what areas to shade and interpreting overlapping regions. It is an important topic in GCSE Maths and a useful method to find solutions to a problem. Make sure to practice drawing graphs of inequalities. The theory is not overly complex, but it is a practical problem that you can learn more effectively by plotting lines yourself on a graph.
To test your understanding, try drawing graphs of inequality online using Desmos. You can also tackle past exam questions on graphs of inequalities using MathsGenie.
If you need help with your revision of this topic, TeachTutti has top GCSE Maths tutors. All tutors have an enhanced DBS check and are student-reviewed. Lessons can be online or in-person to suit your needs.
This post was updated on 09 Jul, 2025.

