Venn diagrams are a helpful way to sort information and tackle probability problems. It was created by the mathematician John Venn in the 1880s to show set theory. They compare groups, show how different sets overlap, and calculate probabilities visually. It appears to be a straightforward topic, but you can lose marks if you misunderstand the notation or the specific wording in the question.
This guide will explain the Venn diagram, including the symbols used, and a method for completing two-set and three-set Venn diagrams. We will show worked exam questions and test your understanding with quiz questions. This article is suitable for GCSE Maths revision for all major exam boards, including Edexcel, AQA, and OCR.
If you need help with these diagrams, TeachTutti has verified Maths GCSE tutors. Every tutor is experienced in preparing students for the GCSEs and will provide bespoke tuition tailored to your needs, such as creating revision notes or explaining the subset of a Venn diagram.
What is a Venn diagram?
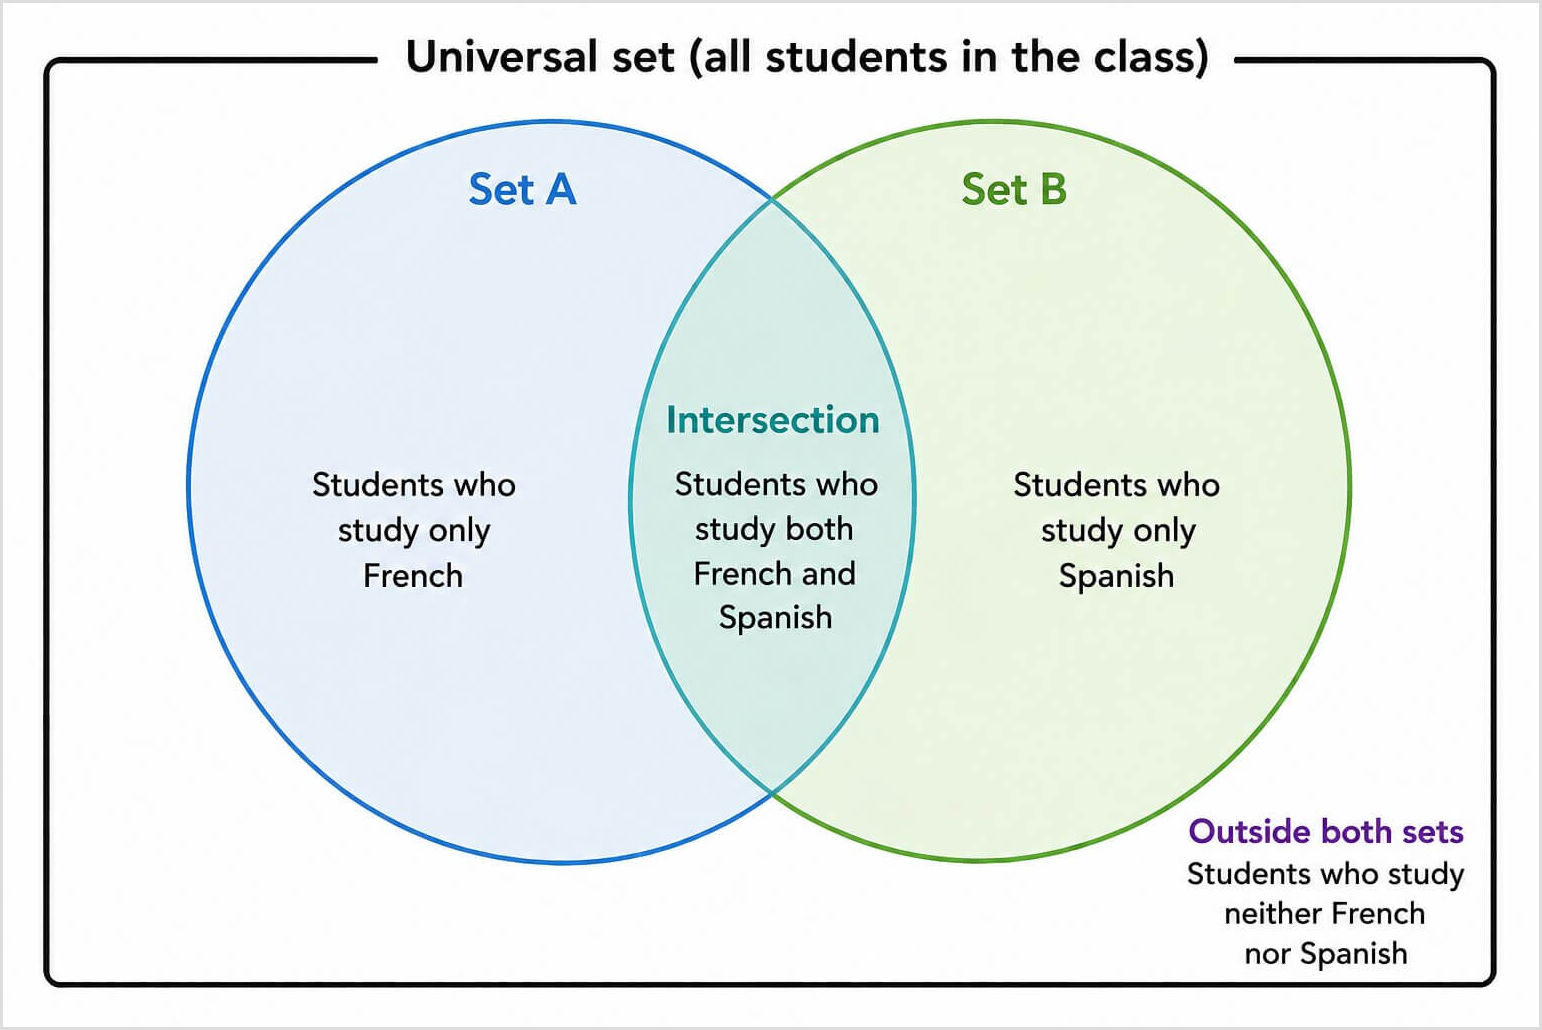
We can see how different objects, called sets, are related to each other using a Venn diagram. The circles have an overlapping section to show which belong to one set, both sets, or neither. They're a common feature of GCSE Maths, and you'll need to understand probability and set notation.
Each set is represented by a circle. Any items in the overlapping section of the circles belong to both sets. This is called the intersection. If an item belongs to just one set, it's placed in the area of the circle that doesn't overlap.
Any items that don't belong to either set are placed outside the circle but inside the surrounding rectangle. This box represents the universal set, which contains every item being considered in the question.
GCSE Venn diagram symbols
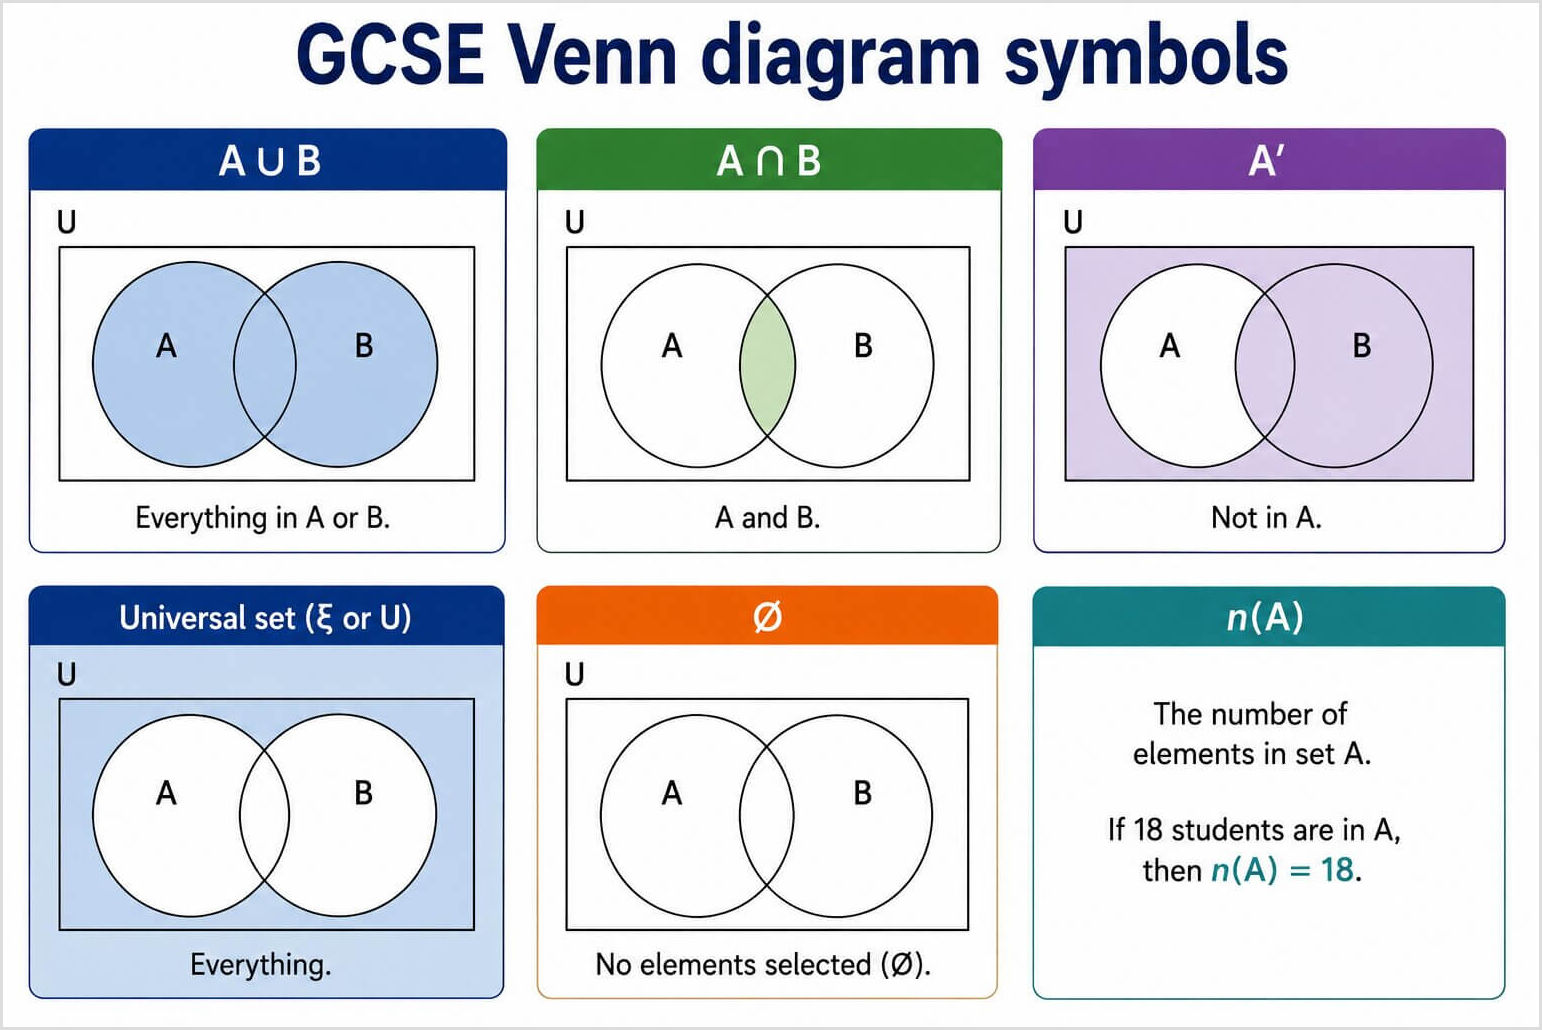
There are a number of symbols used in Venn diagrams. These describe different relationships between sets and will feature in exam questions.
| Symbol | Meaning | Example |
| A u B | Union - everything in set A, or set B, or set A and set B | Students who study French, Spanish, or both |
| A n B | Intersection - items belonging to both sets. Where the circles overlap. | Students who study French and Spanish |
| A' | Complement - everything that's not in set A | Students who do not study French |
| U | Universal set - the total of every item in the question | All students in the class |
| {} | Empty set - a set with no items | No students meet a particular condition |
| n(A) | The total number of elements in set A | If 18 students are in A, then n(A) = 18 |
Be careful not to confuse union (u) and intersection (n). Union means "A or B" and includes everything in either set. This includes the overlapping region. Meanwhile, Intersection means "A and B". It is only the overlapping region of both circles.
For example, let's say set A is students who play football and set B is students who play tennis. A n B is everyone who plays football, tennis or both sports. A u B is only those students who play both sports.
The complement, written as A', is everything outside set A. This includes the area of set B that doesn't overlap with A and the values outside both circles.
How to complete a Venn diagram
To fill in a Venn diagram, you need to follow the step-by-step order below. Failing to do this risks counting values twice and making avoidable mistakes.
- Start with the intersection - Find the items that are in the overlapping section of both circles. These belong to both sets, and the label should be written in the middle of the image.
- Complete the "A only" region - Find out how many items are only in set A. For example, if there are 20 items in A and 7 in both sets, there will be 13 items in set A (20 deducted by the 7 that are shared by set B).
- Complete the "B only" region - Take the same approach for set B. For example, if there are 18 items in set B and 7 of these items are in the intersection, there are 11 items exclusive to set B (18 - 7).
- Complete the region outside both sets - Calculate the items that don't belong to either set. Add the values in the diagram and deduct the total from the total items in the universal set. For example, if there are 40 total items and 31 values in the diagram (13 + 7 + 11), this means there are 9 outside of both sets (40 - 31). Write this label outside of both circles but inside the rectangle/box.
- Check your answer - Add all your values together. The total should equal the total items in the universal set, which is the area inside the rectangle/box.
Worked example: Filling in a Venn diagram
We have given a typical question below for GCSE Mathematics, and worked through the answer step-by-step:
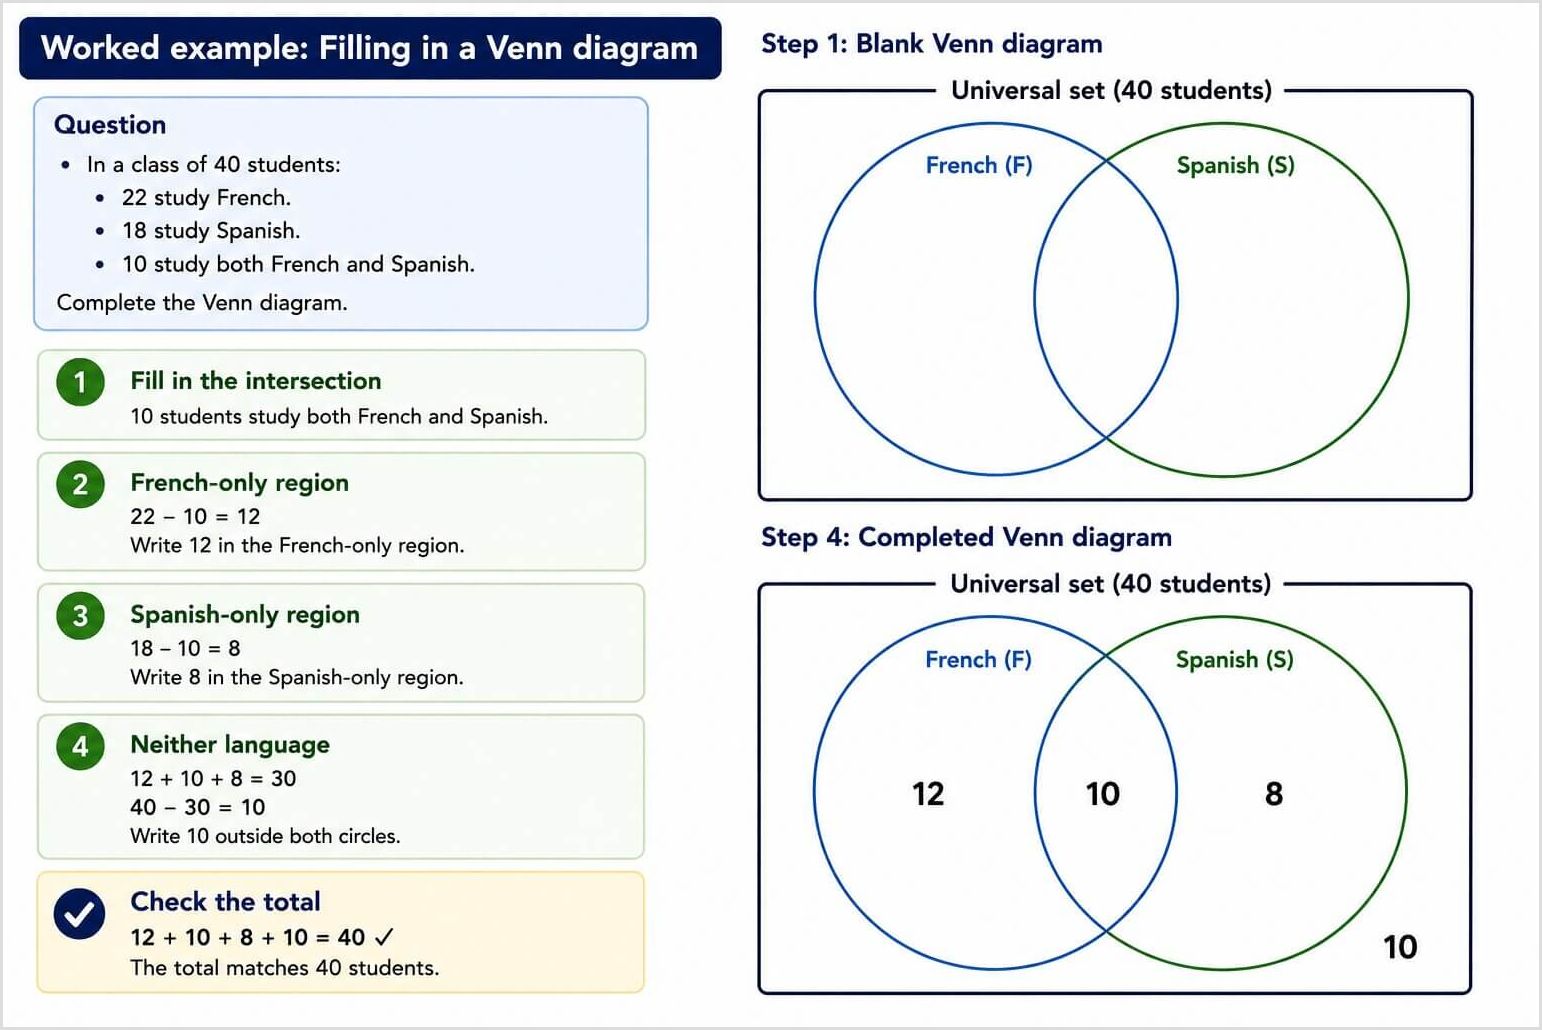
In a class of 40 students, 22 study French, 18 study Spanish, and 10 study both languages. Show this on a Venn diagram.
- Create a Venn diagram - If a blank Venn diagram is not provided, draw your own. There need to be two circles for the French and Spanish sets. Draw a box or rectangle to show the universal set.
- Complete the intersection - 10 students study both languages. This figure needs to be placed in the overlapping section for both circles.
- Calculate the French-only region - 22 students are learning French. If we exclude the 10 students who learn both languages, there are 12 who study only French. Write this in the French-only region.
- Calculate the Spanish-only region - 18 students are learning Spanish. Deducting the 10 students who learn both languages, 8 students are only learning this language.
- Calculate the students who study neither - If we add the values now in the diagram, the total is 30 (12 + 10 + 8). There are 40 students altogether, which means there are 10 who study neither subject (40 - 30). Write this label outside both circles.
- Check the total - It's a good idea to check that every value adds up to the total (12 + 10 + 8 + 10).
Finding probability from a Venn diagram
We can use a Venn diagram to answer probability questions. The probability of an event is found by dividing the favourable outcomes by the total outcomes:
Probability = Number of favourable outcomes / Total number of outcomes
We will use the Venn diagram showing the students who learn French and Spanish. There were 12 learning French only, 8 learning Spanish only, 10 learning both languages, and 10 learning neither. There were 40 students in total.
- French probability - We're looking for the students who study French, including those who also study Spanish. There are 22 French students (12 + 10). The probability is 11/20, simplified from 22/40.
- French and Spanish probability - The word "and" means we need to use the intersection. 10 students study both languages, which is 1/4 (simplified from 10/40).
- Find the probability of French or Spanish - The word "or" means the union of the two sets. This means we need to include everyone inside either circle. This is 30 students (12 + 10 + 8). Therefore, the probability is 30/40 = 3/4.
- Not studying French - We need to include everything outside of French. This means Spanish only (8) and neither subject (10). This means the total not studying French is 18, which is 9/20 as a probability (simplified by 18/40).
Watch for certain words or phrases in the GCSE question, as this will tell you what part of the diagram to use. "A or B" means to use the intersection or overlap, while "A or B" means the union (everything inside either circle). If it says "Not A", you need to count everything outside set B. If the phrase "Neither A nor B" is present, this means counting the region outside both circles.
GCSE exam-style question
We have listed some GCSE Maths questions below. The answer is included for each. Try to complete each question yourself before checking your answer.
Sports survey
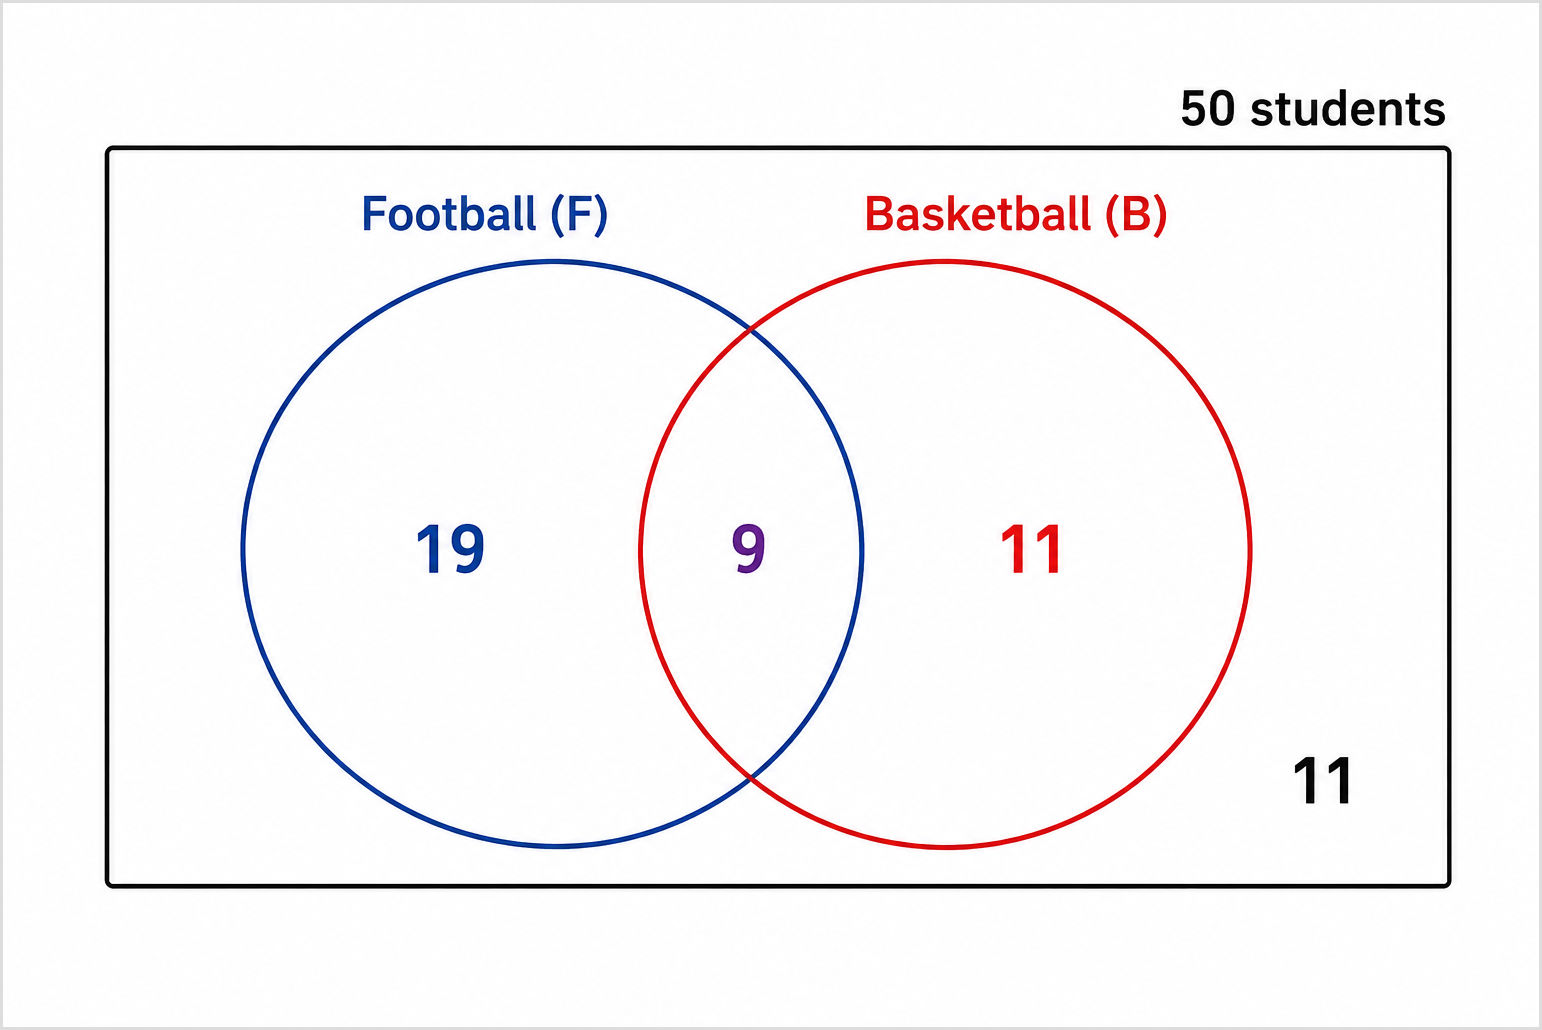
50 students were asked if they play football or basketball. 28 students play football, and 20 play basketball. 9 students play both sports.
Create a blank Venn diagram and fill it with this data:
- Fill in the intersection - There are 9 students who do both sports.
- Calculate the regions - 19 students only play football (28 - 9), 11 play basketball only (20 - 9), and 11 students play neither sport (50 - (19 + 9 + 11)).
- Check your values - There should be 19 students who only play football, 9 who play both sports, 11 who play basketball, and 11 outside these circles who play neither.
Questions and answers - Example 1
Q - What is the probability that a student who is chosen at random plays football?
A - There are 28 football players (19 + 9). This means the probability is 14/25, simplified from 28/50.
Questions and answers - Example 2
Q - What is the probability that a student plays both sports?
A - This is the intersection: P(F n B) = 9/50
Questions and answers - Example 3
Q - How likely is a student to play football or basketball?
A - Include every value inside either circle. The answer is 39 (19 + 9 + 11), which is 39/50 as a probability.
Questions and answers - Example 4
Q - What is the probability that a student doesn't play either sport?
A - There are 11 numbers outside both circles, which means the probability is 11/50.
Guide to Three-set Venn diagrams
For Higher Maths, you may see exam questions with three-set Venn diagrams. There are three overlapping circles, meaning you compare three different sets. Despite the added circle, the same rules apply.
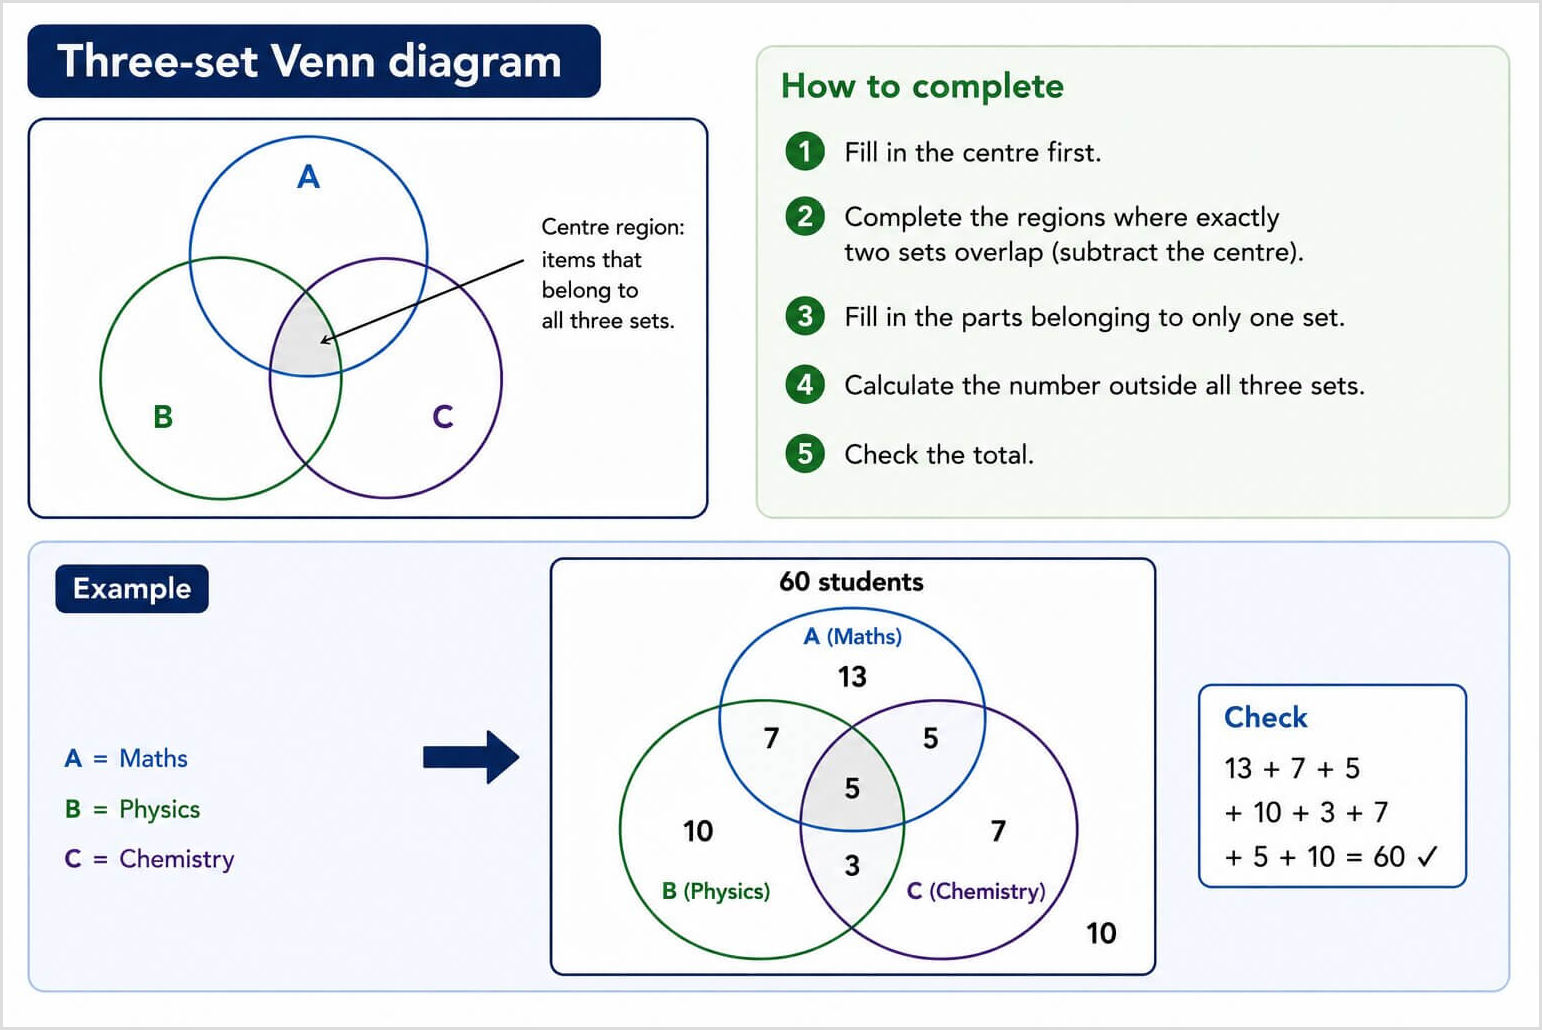
When tackling a three-set Venn diagram, start by working from the middle outwards:
- Fill in the centre - Find out how many items belong to all three sets.
- Calculate where two sets overlap - Remember to deduct the centre value, which you should already have counted.
- Fill in the value for each set only
- Calculate the value outside the sets
- Check that the combined value equals the total in the universal set
Example
There was a survey of 60 students. 30 study Maths, 25 study Physics, and 20 study Chemistry. 12 students study Maths and Physics, 10 study Maths and Chemistry, while 8 study Physics and Chemistry. 5 students study all 3 subjects.
Create a blank Venn diagram by drawing three overlapping circles (see the image above). Write 5 in the centre that overlaps all 3 circles. Then find the regions for two subjects:
- Maths and Physics = 7 (12 - 5)
- Maths and Chemistry = 5 (10 - 5)
- Physics and Chemistry = 3 (8 - 5)
Finally, calculate the regions for each subject only. Then find out how many students study none of these subjects. Check your answer carefully due to the additional calculations.
Quiz questions
1
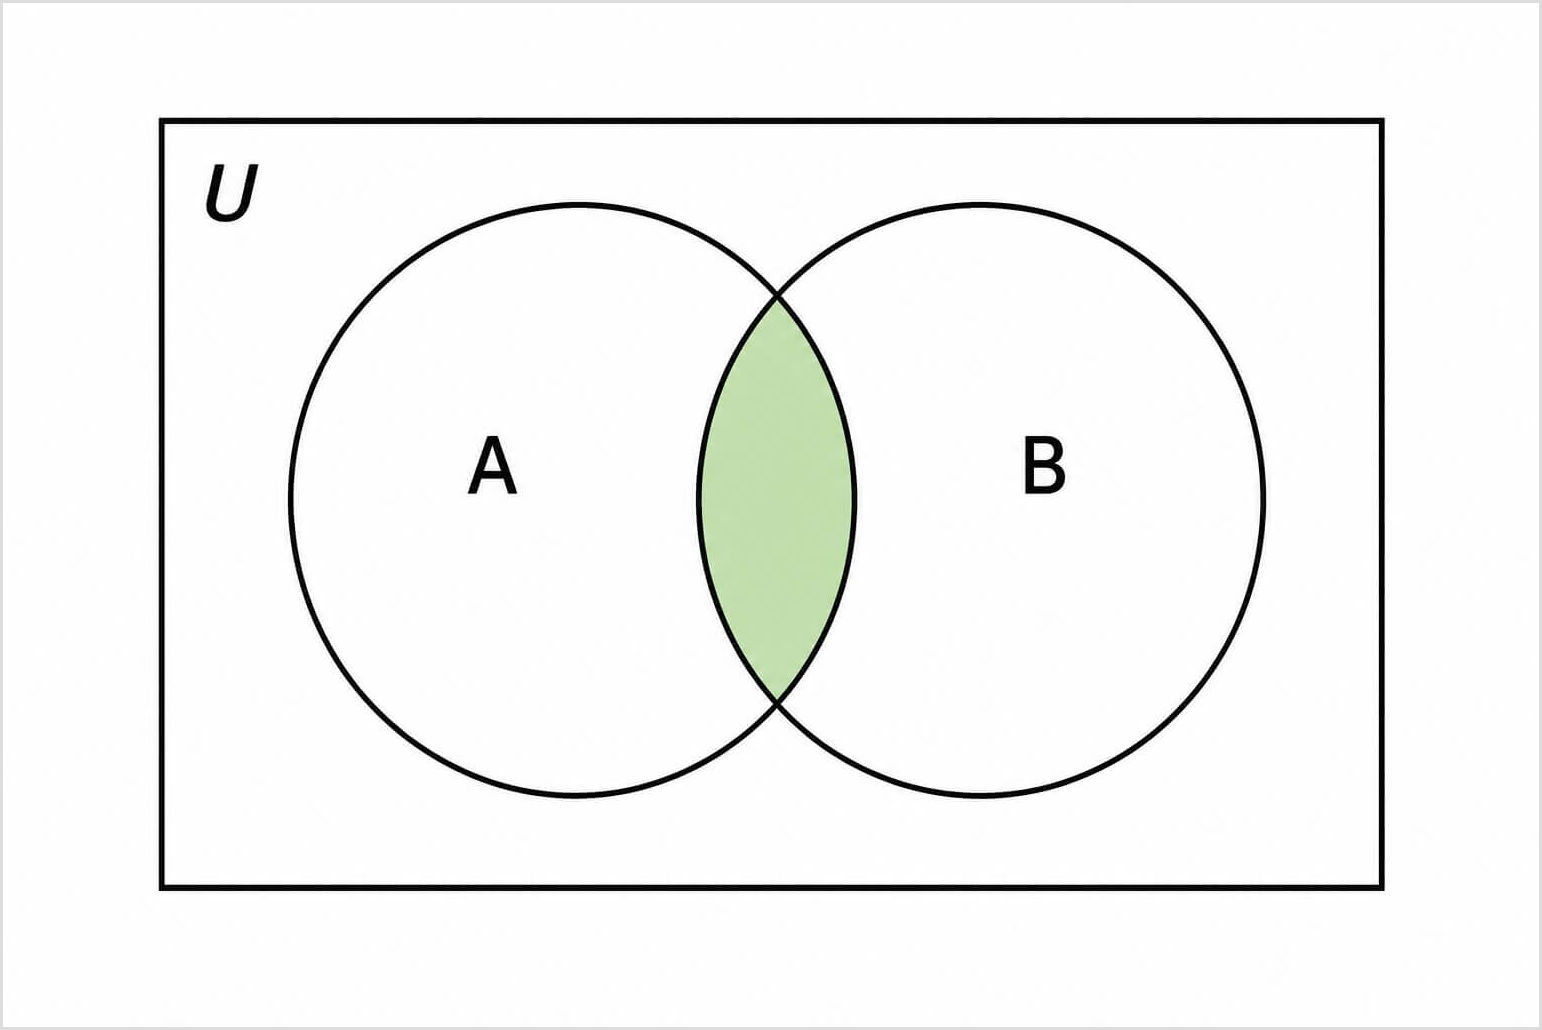
See the green shaded region in the Venn diagram below. What does this represent?
2
A completed Venn diagram has the following: A only = 9; Both = 6; B only = 5; Neither = 10. What is P(A)?
3
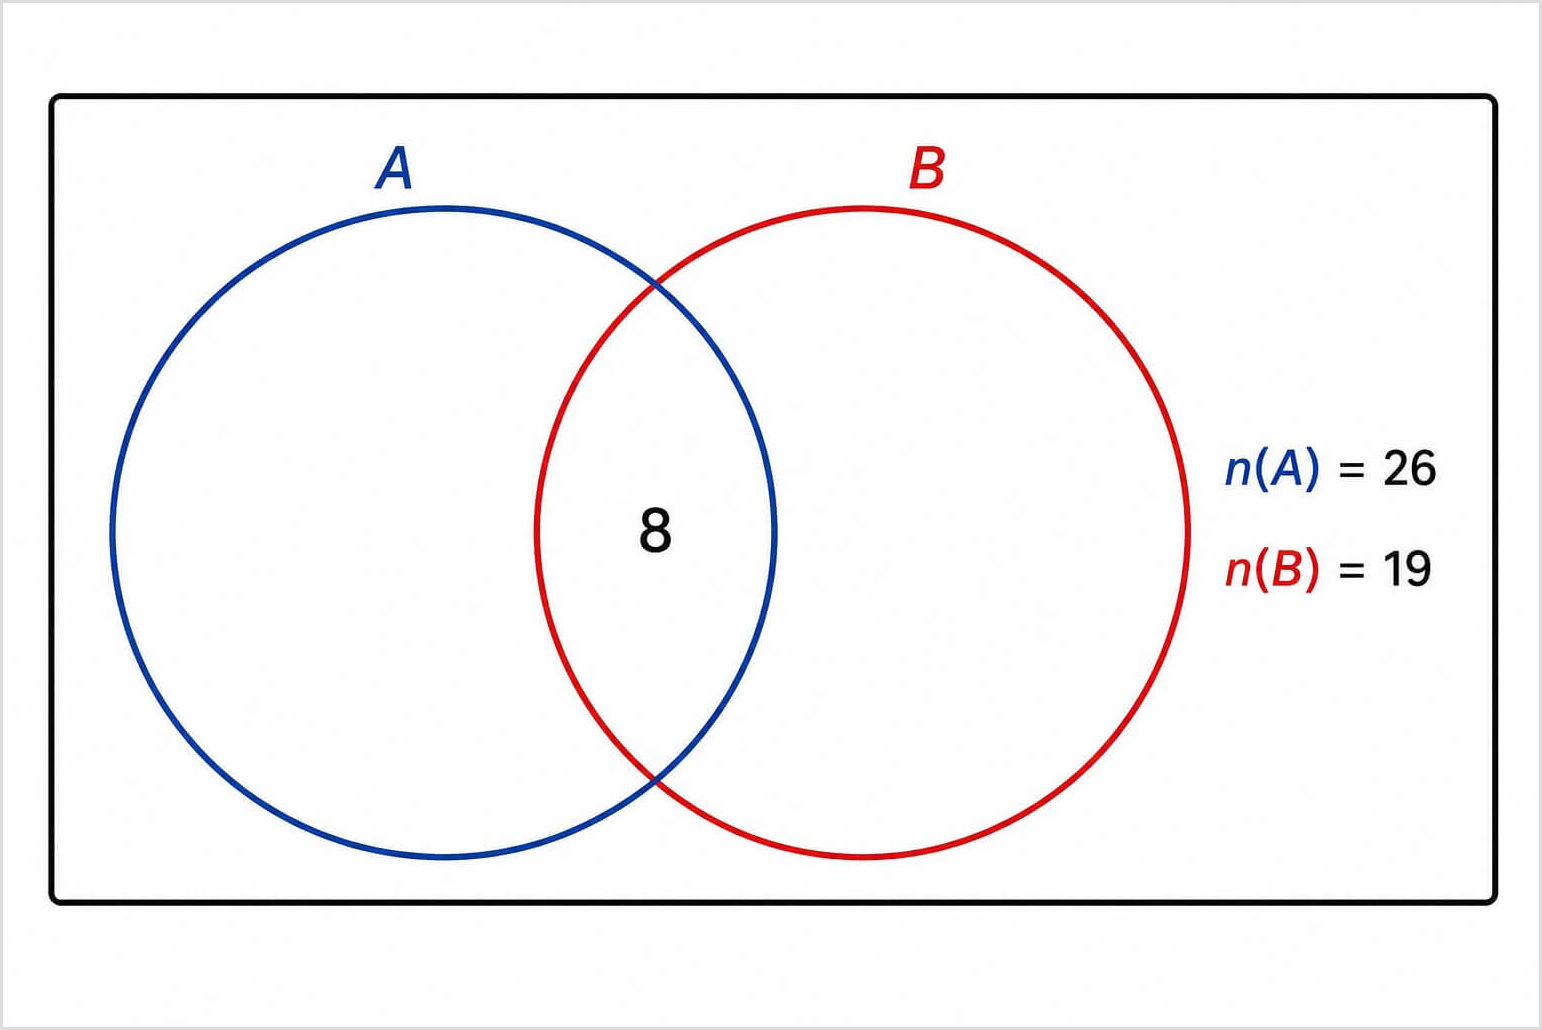
The Venn diagram below is incomplete. What is the value for A only?
4
What does (A u B) mean?
5
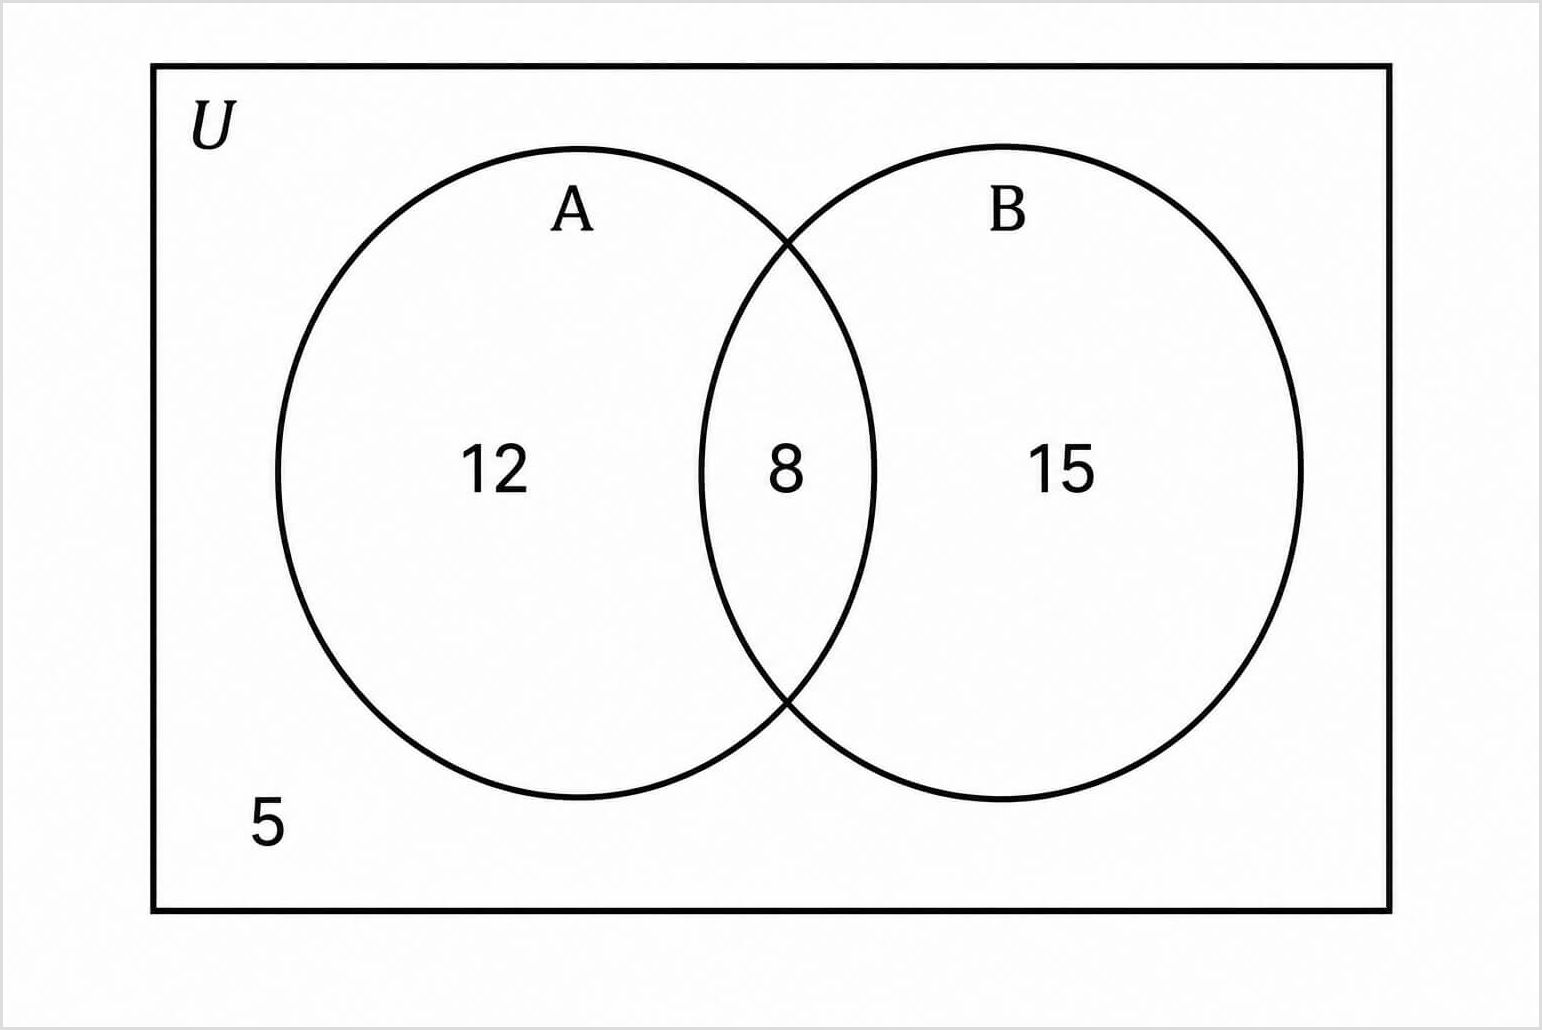
This Venn diagram has already been completed. What region is (A')?
Exam tips for GCSE revision
We have suggested a few strategies to help you tackle Venn diagram questions effectively in GCSE Maths, avoiding mistakes that can affect your marks:
- Start with the overlap - Fill in the intersection first. This value belongs to both sets. If you put it in the diagram before anything else, it stops you from counting it twice by mistake.
- Analyse the question - Watch for words such as "and", "or" and "not". The word "and" means the intersection (n), while "or" means the union (u). The word "not" means the complement of a set. These words tell you what part of the diagram you need to work with.
- Show your working - Write down each step of your calculations. It avoids mistakes and will ensure you get some marks for showing your method, even if the answer is incorrect.
- Double-check the total - Add every region to get the total from the Venn diagram. It should equal the total number of items in the universal set. If they don't add up, check your calculations.
- Simplify - You should always give fractions in their simplest form, such as simplifying 18/30 to 3/5.
- Practise using different contexts - GCSE questions will pose a variety of situations, such as favourite sports, pets, or languages. The method always stays the same, so it's a good idea to test yourself against a range of topics for familiarity.
Final thoughts on Venn Diagram topic
Venn diagrams combine set notation with probability. Always start by finding the value for the intersection, and then work outwards through each set. When you've completed your calculations, check that everything adds up to the total in the universal set. Pay attention to the words in the question, such as "and", "or" and "not". This wording is important as it tells you what part of the diagram to use.
For further reading, you can learn about GCSE Maths probability from Third Space Learning, which will help you to tackle this topic. You can test your knowledge with Venn diagram worksheets by ExamQA. You can also learn about Venn by reading the biography of John Venn on Wikipedia.
If you need help learning this diagram, TeachTutti has qualified Maths GCSE tutors who can teach you at home or virtually using the TeachTutti learning platform. Every tutor has an enhanced DBS check and will tailor lessons to your needs, such as explaining the three-set Venn diagram in more detail.